Discussion
Home ‣ Civil Engineering ‣ GATE Exam Questions See What Others Are Saying!
- Question
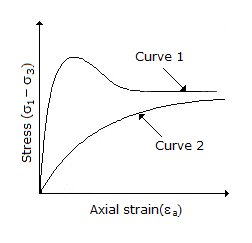
The stress-strain behaviour of soils as shown in the following figure corresponds to :

Options- A. Curve 1 : Loose sand and normally consolidated clay
Curve 2 : Loose sand and over consolidated clay - B. Curve 1 : Dense sand and normally consolidated clay
Curve 2 : Loose sand and over consolidated clay - C. Curve 1: Dense sand and over consolidated clay
Curve 2: Loose sand and normally consolidated clay - D. Curve 1: Loose sand and over consolidated clay
Curve 2: Dense sand and normally consolidated clay - Correct Answer
- Curve 1: Dense sand and over consolidated clay
Curve 2: Loose sand and normally consolidated clay
- 1. Rotation of the camera at exposure about horizontal axis normal to the line of flight, is known as
Options- A. swing
- B. tilt
- C. tip
- D. none of these. Discuss
- 2. The magnetic bearing of a line is 32° and the magnetic declination is 10° 15' W. The true bearing is
Options- A. 21° 45'
- B. 42° 15'
- C. 42° 15' W
- D. 21° 45' W Discuss
- 3. Removal of parallax, may be achieved by focussing
Options- A. the objective
- B. the eye-piece
- C. the objective and the eye-piece
- D. none of these. Discuss
- 4. A floor constructed with the 4 to 6 mm marble chips, is known
Options- A. reinforced marble floor
- B. terrazo floor
- C. marble floor
- D. chip floor
- E. mosaic floor. Discuss
- 5. A tunnel is found more advantageous as compared to the alternate routes because it:
Options- A. remains free from snow
- B. reduces the cost by reducing the route distance
- C. reduces the maintenance cost
- D. avoids interference with surface rights
- E. All the above. Discuss
- 6. The chloride content of treated water for public supplies should not exceed
Options- A. 100 ppm
- B. 150 ppm
- C. 200 ppm
- D. 250 ppm
- E. 300 ppm. Discuss
- 7. For a concrete mix 1:3:6 and water cement ratio 0.6 both by weight, the quantity of water required per bag, is
Options- A. 10 kg
- B. 12 kg
- C. 14 kg
- D. 16 kg
- E. 20 kg Discuss
- 8. According to Water-Cement Ratio Law, the strength of workable plastic concrete
Options- A. depends upon the amount of water used in the mix
- B. does not depend upon the quality of cement mixed with aggregates
- C. does not depend upon the quanity of cement mixed with aggregates
- D. all the above. Discuss
- 9. Average annual rainfall at any station is the average of annual rainfall over a period of
Options- A. 7 years
- B. 14 years
- C. 21 years
- D. 28 years
- E. 35 years. Discuss
- 10. The upper surface of the weir over which water flows, is known as
Options- A. vein
- B. nappe
- C. sill
- D. none of these. Discuss
More questions
Correct Answer: tip
Correct Answer: 21° 45'
Correct Answer: the objective and the eye-piece
Correct Answer: terrazo floor
Correct Answer: All the above.
Correct Answer: 250 ppm
Correct Answer: 14 kg
Correct Answer: all the above.
Correct Answer: 35 years.
Correct Answer: sill
Comments
There are no comments.More in Civil Engineering:
Programming
Copyright ©CuriousTab. All rights reserved.
