Discussion
Home ‣ Electronics and Communication Engineering ‣ Automatic Control Systems See What Others Are Saying!
- Question
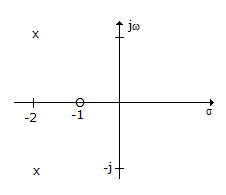
In the given figure shows pole-zero plot. If steady state gain is 2 the transfer function G(s) is

Options- A.

- B.

- C.

- D.

- Correct Answer

ExplanationThe zero at - 1 gives the term (s + 1) in the numerator.The poles at (- 2 + j1) and (- 2 - j1) give (s2 + 4s + 5) term is the denominator. Gain is 2.
More questions
- 1. The characteristic impedance of a cable is about
Options- A. 300 ?
- B. 50 ?
- C. 5 ?
- D. 2 ? Discuss
Correct Answer: 50 ?
- 2. A copper atom is neutral. Its core has a net charge of
Options- A. 0
- B. + 1
- C. - 1
- D. + 2 Discuss
Correct Answer: + 1
- 3. The characteristics of which device has peak point and valley point
Options- A. SCR
- B. PUT
- C. SCS
- D. Shockley diode Discuss
Correct Answer: PUT
- 4. Schrodinger wave equation is partial differential equation.
Options- A. True
- B. False Discuss
Correct Answer: True
- 5. The output frequency of a cycloconverter can be changed by changing the firing angle.
Options- A. True
- B. False Discuss
Correct Answer: False
- 6. Most of the memory chips in static RAM
Options- A. do not require any supply
- B. need 2 V supply
- C. need 5 V supply
- D. need 12 V supply Discuss
Correct Answer: need 5 V supply
Explanation:
Digital chips need 5 V supply.- 7. In crystalline solids, atoms are stacked in a regular manner.
Options- A. True
- B. False Discuss
Correct Answer: True
- 8. The classes of solid dielectrics are
Options- A. A, B, C, D, E, F, H
- B. A E B F H C D
- C. Y A E B F H C
- D. A E B F H C Discuss
Correct Answer: Y A E B F H C
- 9. The unit for mmf is
Options- A. A
- B. Wb
- C. T
- D. V Discuss
Correct Answer: A
- 10. In a single phase full wave regulator, the firing angles in the positive and negative half cycles are generally
Options- A. equal
- B. different
- C. equal or different
- D. different but sometimes equal Discuss
Correct Answer: equal
Explanation:
Firing angles are kept equal to get symmetrical output voltage.
Comments
There are no comments.
More in Electronics and Communication Engineering:
Programming
Copyright ©CuriousTab. All rights reserved.
